Apollo II |
||
"Nonrenewable resources should be exploited, but at a rate equal to the creation of renewable substitutes."
|
Our future is impossible as long as the citizens of the USA and those who emulate the USA consume their body weight in oil each week.
With reserves that, absent imports, would be used up in 4 years, the USA in particular is in no position to alienate its neighbors. Rather than invade oil-rich countries, drill for oil in pristine and marginal fields, or further endanger our planet with nuclear proliferation (in any country), humanity must mount a massive effort to create a viable renewable energy solution. If Iceland and the Galapagos Islands can do it, certainly the G8 and OECD nations can.
As John F. Kennedy called for a massive commitment, "We choose to go to the moon," it is now time to reach for [power from] the sun.
For humanity's sake, to replace the demands we are currently making on fossil fuels with renewable energy sources, we must increase the use of wind power, hydro-electric, photovoltaics, biomass, and other renewable systems world wide by perhaps 20-35% or more per year. We are calling this great mobilization "Apollo II."
Renewable Energy is about to become a profound growth industry, almost as dramatic as the electronic commerce fostered by the emergence of the World Wide Web. Here we present the goals and guidelines for this transition as proposed by various experts and renewable energy associations around the world.
Readers are encouraged to provide us with renewable energy goals prepared by experts and/or organizations to post here.
"50 Gigawatts by 2010 "Plausible" At the Second Annual Conference of the American Council For Renewable Energy (ACRE) In Washington D.C. this month, Steven Taub, Director, Cambridge Energy Research Associates (CERA) in Massachusetts presented his views on the State of renewable energy in America."
Technical Papers: Apollo 2: Solar Energy Meets the New Global Challenge, presented at ISES Millennium Solar Forum 2000 [2000 September]
News: Click here for news and updates.
Photos: View images of renewable energy systems.
| Wind energy installed capacity | |||||
|---|---|---|---|---|---|
| Year | North America (MW) | Europe (MW) | India (MW) | World (MW) | Growth (%) |
| 1992 | 1,700 | 900 | ? | 2,650 | . |
| 1993 | 1,725 | 1,270 | ? | 3,050 | 15% |
| 1994 | 1,729 | 1,650 | 383 | 3,850 | 26% |
| 1995 | 1,770 | 2,170 | 565 | 4,480 | 16% |
| 1996 | 6,115 | 36% | |||
| 1997 | 7,640 | 25% | |||
| 1998 | 9,940 | 30% | |||
| 1999 | 13,840 | 39% | |||
| .... | .... | .. | |||
| 2004 | 39,294 | ||||
| Projections | |||||
| 2005 (est) | 18,500 | ||||
| adapted from Gipe 1994, AWEA 1996, WorldWatch 1999, AWEA 2004 |
|||||
As is documented in the references cited here, global energy demand will require much more aggressive goals than this, and for its failure to gain the support of government, or perhaps its failure to recognize the extent of global demand, the U.S. wind energy industry has been losing market share, especially to the industry in Denmark and Germany. For example, the European Wind Energy Association, the Danish Forum for Energy Development and Greenpeace recently released "Wind Force 10," calling for wind to provide 10% of global electricity by the year 2020.
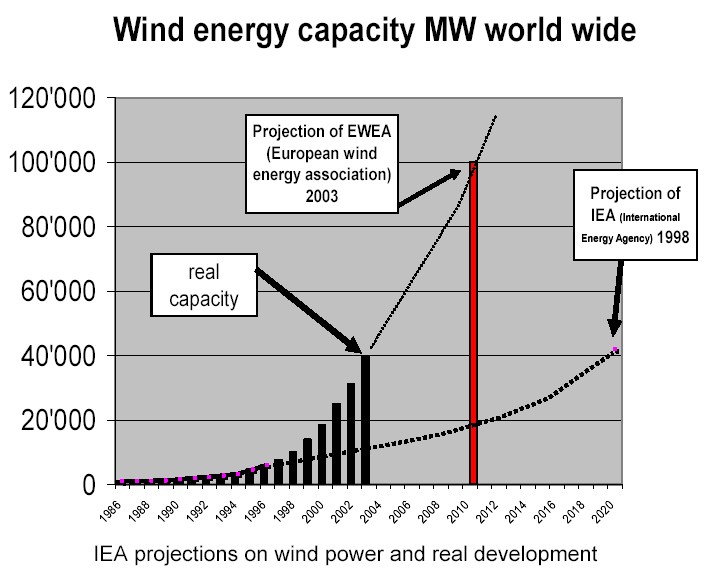
In 1996, AWEA reported that worldwide installed wind power capacity had surged to over 5,000 MW during the first quarter of 1996 and that total global installed wind power capacity would reach over 18,500 MW by 2005. This modest goal was exceeded twice over by 2004, demonstrating that growth has been consistently higher than industry estimates.
Meanwhile the European Wind Energy has been assertive in its projections of wind energy growth whereas the International Energy Agency has widely missed the mark in its predictions.
If predictions are true that the rate of global oil extraction will peak (the "Hubbert Peak") by 2010, then humanity must ramp up far more quickly than governments and even the pro-renewable trade associations are projecting. For example, AWEA's projected growth in the installed base in 1996 was about 14% per year, but the rate of growth for industrial capacity projected in their scenario was only 0.7%, less than 1% per year! Assuming that oil "production" capacity will increase to 65 million barrels per day and then drop down to 40 million barrels per day by the year 2020, the growth rate of wind turbine industrial capacity required to meet just 20% of that oil shortfall (equivalent to 1,062 GW) is 22% per year, not 0.7%!
If there are doubts about humanity's ability to do this, note the 250% increase of India's wind power capacity in two years, from 1994 to 1996! This level of growth is feasible and appropriate, considering that the Energy Payback Time ("EPBT") for Wind Turbines can be as little as two to three months.
Many other countries, for example, European countries (see data conflicting with adjacent graph) and South Africa are stepping up efforts to develop their wind energy industries.
| World PV Module Shipments Consumer and Commercial | ||
|---|---|---|
| Year | Shipments (MW) | Growth (%) |
| 1986 | 26 | . |
| 1987 | 29 | 12% |
| 1988 | 34 | 17% |
| 1989 | 40 | 18% |
| 1990 | 47 | 18% |
| 1991 | 54 | 15% |
| 1992 | 58 | 7% |
| 1993 | 61 | 5% |
| 1994 | 71 | 16% |
| 1995 | 81 | 14% |
| 1996 | 89 | 10% |
| 1997 | 126 | 42% |
| 1998 | 155 | 23% |
| 1999 | 201 | 30% |
| 2000 | 288 | 43% |
| 2001 | 391 | 36% |
| 2002 | 562 | 44% |
| 2003 | 744 | 32% |
| 2004 | 1,200 | 61% |
| 2005 | 1,744 | 45% |
| 2006 | 2,204 | 26% |
| 2007 | 2,400 | 9% |
| 2008 | 5,500 | 129% |
| 2009 | 7,300 | 33% |
| 2010 | 18,200 | 149% |
from
|
||
|
|
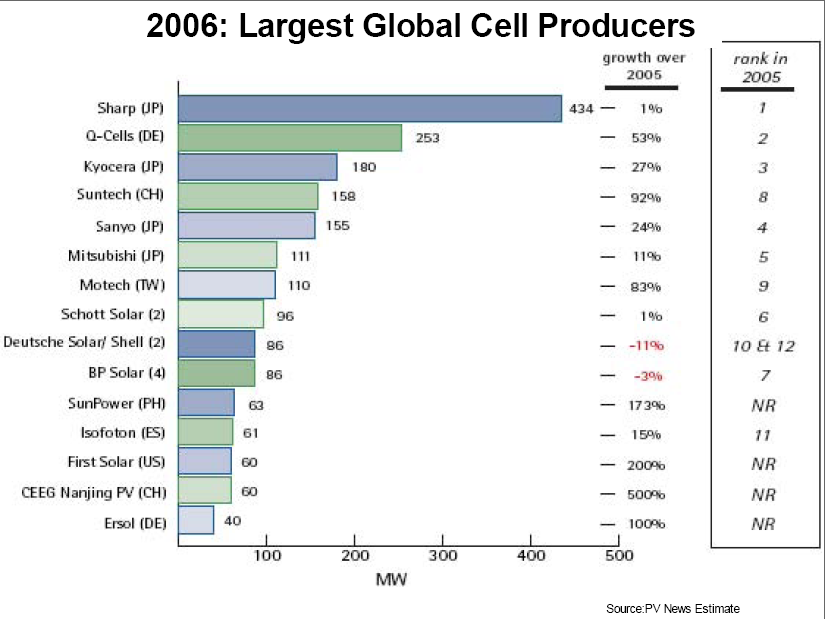 |
 It is known that production claims are exaggerated by some companies. more details |
|---|
50,000,000 cars/yr � 100 hp � 746 watts/hp � 10 min / (60 min/hr � 8,760 hrs/yr) = 71 megawatts per year.
This is about the amount of photovoltaics capacity that was produced worldwide in 1994. We have a long way to go to create a sustainable transportation system. If it were to be based on photovoltaics, we would have to expand production by a factor of 8,760 � 60 / 10 = 50,000�!!
The slow rate of growth shown here is about to change. As photovoltaic technologies mature, the energy payback leverage factor will be sufficient to justify entry of photovoltaics in the general electricity market.
"PV module manufacturing capacity [in the U.S.A.] has increased by more than a factor of 6 in the last 4 years.... In addition, the ... cost for manufacturing PV modules has been reduced by about 56%" from Photovoltaics Insider's Report, June 1996
To show how this is likely to continue to accelerate, we have created a scenario for PV to meet 20% of the projected oil shortfall by the year 2020. Conclusion: If world oil climbs to 65 million barrels/day around the year 2000 and then declines to 40 million barrels/day by the year 2020, PV industrial capacity must grow by 32% per year to meet 20% of the shortfall.
One group which has taken this matter seriously is GreenPeace in the Netherlands which commissioned a study in 1999 to determine the feasibility of large scale PV production: See Solar PV Electricity Can Be Competitive with Conventional Power in the Short-Term: KPMG Business Analysis for Greenpeace.
 See also A Realizable Renewable Energy Future [pdf, 142 kb] by John A. Turner in Science, July 30, 1999. At right: area required for PV to produce all US electricity needs. (Obviously roofs and parking lots make better candidates, but the point is made.)
"Currently valued at about $1 billion a year, the solar business has recently attracted sizable investments by major energy companies.... These companies and others are investing in new manufacturing plants: factories announced over the last year alone could double global production of solar cells in the next few years. A growing portion of the world's solar cells is going to meet the needs of ordinary households, according to Worldwatch. From tiny huts in rural Dominican Republic to trim suburban homes in Osaka Japan, some 500,000 homeowners are now generating their own power. For the 2 billion people worldwide who are not yet connected to power lines, solar energy is often the most affordable way to get electricity." [WorldWatch, 98.7.16]
While there has been real growth in the USA in recent years ... nonetheless, there was an actual decline in production in the USA in 2003.
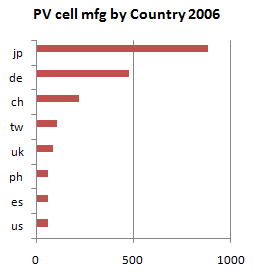
| Year | USA | Japan | Europe | Rest of world | Total | |||||
| 2003 | 103.02 | -15% | 363.91 | 45% | 193.35 | 43% | 83.80 | 52% | 744 | 32% |
| 2004 | 140 | 36% | 500 | 37% | 300 | 55% | 140 | 67% | 1,050 | 41% |
"When it comes to MW estimates of PV cell production levels, Industry Analyst Paul Maycock estimates that 2004 figures should show at least 1,050 MW. Japan leads production at 500 MW, Europe is second at 300 MW, the United States has 140 MW, and the rest of the world balances out production at 140 MW."
For a practical and detailed technical explanation of photovoltaics (solar electricity), see Mysolar.Com.
Several years ago, Oil and Solar Greenpeace International Briefing provided interesting facts and projections for photovoltaics.
Additional information about photovoltaics
See The Status and Future of Geothermal Electric Power by Charles F. Kutscher, NREL from the Proceedings of the American Solar Energy Society Annual Conference proceedings, June, 2000.
| Energy Growth by Source (1990-1999) | |
|---|---|
| Energy Source | Yearly Growth Rate |
| Wind Power | +24.2% |
| Photovoltaics | +17.3% |
| Geothermal | +4.3% |
| Natural Gas | +1.9% |
| Hydroelectric | +1.8% |
| Oil | +0.8% |
| Nuclear | +0.5% |
| Coal | -0.5% |
| Source: Vital Signs 2000, Worldwatch Institute | |
In 1999, wind energy capacity increased from about 9,940 MW to 13,840 MW -- 39% -- a rate of growth that is on the scale deemed necessary to meet the challenge imposed by the impending decline in global oil production.
Shell Oil has projected rapid growth in renewable energy during the 21st century. "In the first Shell scenario, called Sustained Growth, the world energy consumption grows an average of 2% per year. Of that total, renewable energy will constitute 15% by the year 2000, and in 2065 even 65%. The second scenario, christened Dematerialization, is based on an energy consumption growth of 1% per year, as a result of higher taxes on fuels and application of new technology to give a great boost to energy conservation. This results in keeping expensive fossil fuels in the ground, and gives an extra stimulus to renewable energy."
Renewables account for 18 percent of the world's commercial energy production, the U.N. Educational, Scientific and Cultural Organization says. That could reach 30 percent by 2050 if governments and investors finance projects in 61 countries, as called for at a U.N. conference on solar energy in September, 1996 in Harare, Zimbabwe, UNESCO says.
"The developing world share of the total global energy consumption has increased from 17% in 1970 to over 23% in 1992. It is projected to reach approximately 40% by 2020. " from Photovoltaic Manufacturing in Developing Countries by G. Darkazalli and M. Nowlan, Spire Corporation, 1996
Profile of Asian energy systems today
 California
Even though California is not a country, it produces 54 percent of the world's wind electricity, 40 percent of the world's geothermal power and 90 percent of the world's solar electric power. When combined with hydroelectric generation, California's alternative energy industry produces 25 percent of the state's electricity supply.
 India
India
| Indian PV shipments | ||
|---|---|---|
| Year | MW | increase |
| 1993 | 4 | - |
| 1994 | 5.5 | 37% |
| 1995 | 7.5 | 36% |
| 1996 | 9-10 (est) | 20-33% |
| 1995 Shipments by Application | MW |
|---|---|
| Street lighting systems | 2.20 |
| Domestic lighting | 1.75 |
| Pumping | 1.20 |
| Central Power | 0.75 |
| Lanterns | 1.20 |
| TV | 0.20 |
| Other | 1.00 |
| Total | 7.50 |
| from PV News Paul Maycock, editor June 1996 | |
European Union Chasing Goal for Renewables,
In 1997, the European Commission released a white paper on renewable sources of energy, in which it noted that renewables are unevenly and insufficiently exploited in the European Union. Contributing less than 6% to the EU's energy consumption, it called for a joint effort to increase this level for export potential and to address climate change. More than half of Europe's energy is imported, and will rise to 70% by 2020 without action. Different scenarios show the contribution of renewables by 2010 to range from 9.9% to 12.5%, but a goal of 12% renewables share ("an ambitious but realistic objective") was set, to be achieved through the installation of one million PV roofs, 15,000 MW of wind and 1,000 MW of biomass energy. The current 6% share includes large-scale hydro, which will not expand for environmental reasons. Growth is expected from biomass, followed by 40 GW of wind and 100 million square metres of solar thermal collectors.
 Indonesia
The success of recent "Solar Village" projects, resulting in the installation of 10,000 Solar Home Systems, has "... prompted the Government of Indonesia to launch what is known as the 'Fifty Mega Watt Peak (50MWp) Photovoltaic Rural Electrification in Indonesia' or 'One Million Rural Solar Home System Project.' The ultimate goal of the project is to provide electricity to one million households, about 10% of those 10 million rural families without electricity, within ten years." [Proceedings of the Annual Conference of the Australian and New Zealand Solar Energy Society, Darwin, 22-25 October 1996, pp. 525+]
Indonesia Awards Solarex Contract to Build 36,400 Home PV Systems [Solar Energy Intelligence Report, June 18, 1997]
 Jamaica
| Jamaica's Commercial Energy 1995 | ||
|---|---|---|
| Present energy sources (90% dependent on imports, which cost US$352 million) | Petroleum | 88.8% |
| Bagasse | 5.7% | |
| Fuelwood | 2.6% | |
| Charcoal | 1.0% | |
| Coal | 1.0% | |
| Hydropower | 0.9% | |
| Electricity, net generation | 2,417 GWh | |
| Electricity, peak demand | 400 MW | |
| Electricity, generating capacity | JPSCo | 507 MW |
| Independents | 123 MW | |
| Projections | ||
| Electricity, additional capacity needed by 2005 (What portion will be renewables?) | 400 MW | |
| from Jamaica's Energy by Raymond Wright, 1996 | ||
 Japan
Japan
"The New Sunshine Project" has set a goal of 400 MegaWatts Photovoltaics in Japan by the year 2000 and 4.6 GigaWatts PV by 2010. This includes plans to put PV panels on 70,000 homes. 2,000 were put up in 1995; there were plans for 2,000 more in 1996, "some 9,400 solar home systems [were] installed in 1997, and another 13,800 [are] expected by the end of 1998. Generous tax credits and high electricity purchase prices have given the Japanese program a strong boost, encouraging major building companies to bring out new lines of solar powered homes." [WorldWatch, 98.7.16]
 Mexico
We have drafted a preliminary discussion paper for a program to be called Apolo II (en espa�ol) to expand commercial solar energy usage in Mexico by 30%+ per year for the next decade.
Mexico has 32 GW of installed electrical capacity, generating more than 141,000 GWH each year. The Federal Electricity Commission (CFE) intends to begin construction before the year 2000 on new electric power generation plants that will increase installed capacity by 9 GW. The CFE offers a projection (en espa�ol) of 4.2% increase in electricity generation capacity in the next decade (1995-2004). Most of this projection is based on fossil fuels, even though Mexico's oil reserves have been called into question.
 Philippines
| Philippines Energy Generation Mix 1996 | ||||
|---|---|---|---|---|
| Type | 1994 | 2000 | 2005 (%) | 2005 (GWH) |
Imported Sources | ||||
| Oil | 55% | 31% | 15% | 15,255 GWH |
| Coal | 3% | 28% | 16% | 15,301 GWH |
| Total Imported | 58% | 59% | 31% | |
Indigenous Sources | ||||
| Hydro | 19% | 10% | 11% | 10,660 GWH |
| Geothermal | 21% | 23% | 15% | 15,006 GWH |
| Coal | 2% | 8% | 7% | 6,511 GWH |
| Natural Gas | 0% | 0% | 21% | 20,773 GWH |
| Total Indigenous | 42% | 41% | 54% | |
Other | 0% | 0% | 15% | 14,612 GWH |
| Total | 100% | 98,118 GWH | ||
|
The Philippine government's policy is to accelerate promotion and commercialization of NRES.
The government's goal: 50 MW of NRES capacity annually starting 1998; projects must meet price criteria, must be viable, must run on 100% renewable resources. |
| Philippines New and Renewable Energy Systems (NRES) Potential 1996 | |||
|---|---|---|---|
| Source | Untapped | Existing capacity | |
| Total | 10,016 MW | 100% | |
| Hydro | 10,000 MW | 2,259 MW | 23% |
| Geothermal | 270 MW to 1,600 MW | 1,194 MW | 12% |
| Wind | average wind power density in the country 30.8 watts/m2 | ||
| Biomass | potential of 19.2 million tons of oil equivalent (TOE) by 1996, 41.7 million TOE by 2025 | ||
| Solar | average solar radiation based on sunshine duration is 161.7 watts/m2 | ||
| Ocean resource | 1,000 sq km, potential unknown | ||
| from Opportunities for Investment in Renewable Energy Projects in the Philippines by Pio J. Benavidez, National Power Corporation, 1996 | |||
 UK
UK
1999 Feb 08: U-K Photovoltaic Industry Sets a Goal of 300 MW by 2010, "According to "Trends in Renewables, issue #66", the British PV industry sells 100 million pounds a year in solar cells (10% of the world market), but the US, Germany, Netherlands and Japan have strategic government programs (such as Germany's program to install 100,000 PV roofs that was announced within 90 days by the new Schroeder government), while support in the U-K is minimal. The British Photovoltaic Association told a Parliamentary committee that it wants to achieve 15% market share by installing 300 MWp of domestic capacity by 2010, creating 19,000 jobs and reducing CO2 emissions by 165,000 tonnes per year. Despite thousands of PV systems in Britain, only 30 buildings are large.
 US
US
In 1996 The American Wind Energy Association, AWEA, projected that U.S. wind capacity additions would grow slowly until about 2000, and then increase over the next several years, totalling about 2,700 MW of new capacity by 2005. At the end of 2003, U.S. capacity reached 6,374 MW.
At the 2004 International Conference for Renewable Energies in Bonn, Germany, USA Delegate David Garman (Assistant Secretary, Energy Efficiency and Renewable Energy, USA Department of Energy) sidestepped the issue of renewable energy industry growth by simply proclaiming modest price reduction targets for 2010 and 2020. In the context of this timid policy prognosis the losers will be USA citizens forced to live in the dark and USA industry steadily losing market share in the renewable energy field.
The debate -- taking conflicting views in stride.
Sponsored by  |
updated 2007 April 5 contact us |